
What Is Packaging Line Integration?
Packaging line integration means connecting multiple packaging machines — filling, sealing, labeling, inspection, cartoning, and palletizing — into a single, coordinated, automated production system. It is not the same as automation. Automation makes one machine run by itself. Integration makes five, eight, or twelve machines run together without crashing into each other.
Think of an orchestra. Each musician can play alone, but without a conductor, a shared score, and rehearsed transitions, you don’t get a symphony — you get noise. On a packaging line, the conveyor is the baton, the PLC is the conductor, and every machine is an instrument that must enter and exit at exactly the right moment.
A well-integrated line knows when to speed up, when to buffer, and when to stop — and it does all three without human intervention.
A typical food packaging line contains five to twelve individual pieces of equipment. Run those machines as standalone units — with operators manually moving products from one station to the next — and a line might need three to six workers per shift just to handle transfers. After integration, that same line usually needs only one or two operators. Their job shifts from material handling to quality monitoring. The difference rewrites the facility’s labor budget, throughput ceiling, and quality floor.
Packaging line integration also covers control systems, communication protocols, data architecture, and process design. The sections ahead walk through what makes up an integrated line, how the technology works, how to plan a project, what mistakes to avoid, and how to evaluate whether integration makes financial sense for your operation.
The Core Components of an Integrated Packaging Line
Before you design an integrated line, you need to know its functional zones. One principle to carry through this entire section: a line’s real throughput is not set by its fastest machine. It is set by its slowest link — and by whether the interfaces between links can handle speed differences. Every zone below must match the ones before and after it in three dimensions: physical height, conveying speed, and communication protocol.
Product Feeding and Metering
The line starts here. Get this stage wrong and every downstream problem traces back to it. Different product forms demand fundamentally different feeding approaches:
- Free-flowing solids (coffee beans, nuts, candy) work with bucket elevators or vibratory feeders. A multihead weigher delivers ±0.5 g precision at high speed — the standard choice for snack and dry food lines.
- Powders (milk powder, protein powder, flour) need screw conveyors or vacuum conveying. Three hurdles: dust containment, moisture protection, and density variation. An auger filler holds ±1–2 g accuracy when the powder’s bulk density is stable, but drifts significantly if the powder settles or clumps.
- Viscous liquids and pastes (sauces, jams, peanut butter, pet food) need piston fillers or progressive cavity pumps. Viscosity stability makes or breaks this setup — a product that flows like honey in summer and paste in winter defeats any filling system not designed for that range.
- Fragile solids (cookies, chips, freeze-dried fruit) demand gentle handling — inclined belt conveyors with low drop heights and product-specific guide rails.
The feeding system must run at least 10% faster than the downstream filler. If it doesn’t, the filler starves and the whole line hunts for product.
Primary Packaging — Filling and Sealing

This is where product becomes a package. The combination of filling technology and sealing method determines shelf life, product integrity, and — for regulated industries — compliance.
| Filling Method | Best For | Typical Precision |
|---|---|---|
| Piston filler | Pastes, chunky products, pet food | ±1–2% by volume |
| Auger filler | Powders, fine granules | ±1–2 g |
| Multihead weigher | Nuts, snacks, dry solids | ±0.5 g |
| Flow meter | Free-flowing liquids | ±0.5% by volume |
| Gravity/time filler | Thin liquids, water-like | ±1–2% |
Sealing technology must match both container type and preservation needs:
- Vacuum sealing evacuates oxygen before sealing — essential for canned meats, seafood, and coffee. Target vacuum level: -0.08 MPa.
- Nitrogen flushing displaces oxygen with inert gas, cutting headspace oxygen below 3%. Standard for milk powder, nutrition supplements, and premium nuts — products where oxidation equals revenue loss.
- Double-seam can sealing belongs to the world of metal cans. Quality metric: seam overlap ≥55%. Seaming rollers wear out; a set typically processes 50–100 million cans before replacement.
- Induction sealing bonds an aluminum foil liner to the container rim using electromagnetic energy — common in edible oil, pharmaceutical syrup, and chemical product packaging.
Quality Control — Inspection Systems
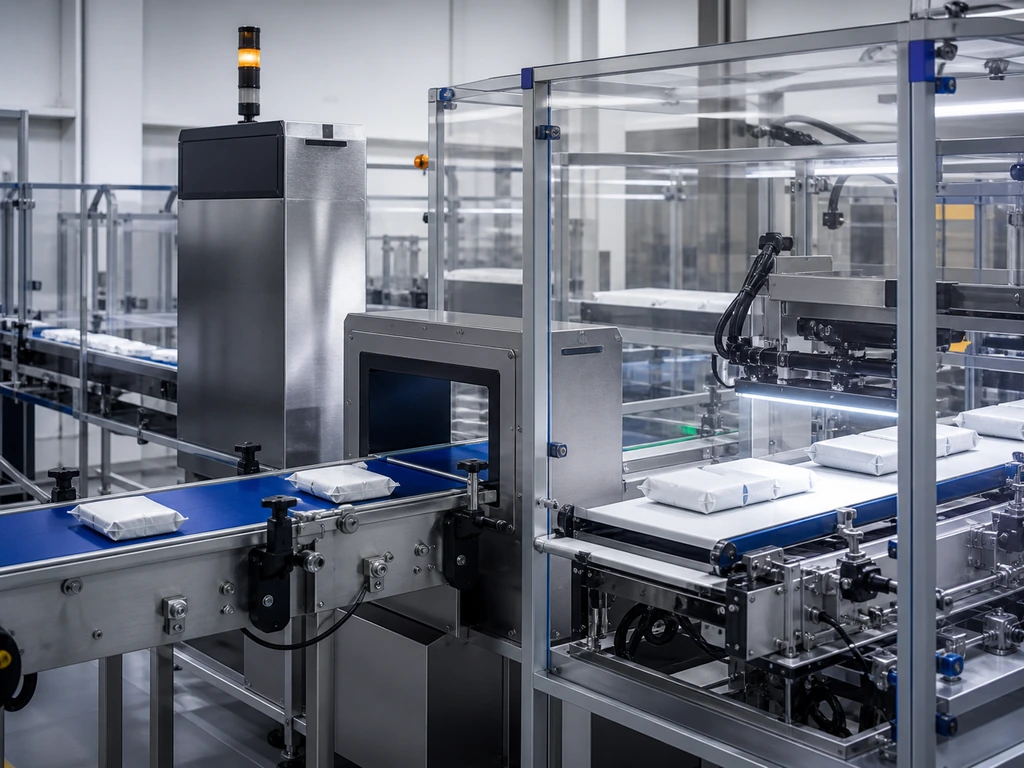
In an integrated line, inspection is not a sampling exercise. Every single unit passes through — and the system must catch, reject, and log every defect in real time.
Labeling, Coding, and Traceability
This is the identity layer — and where FDA or EU compliance auditors spend most of their time.
Three technologies, three purposes: Pressure-sensitive labeling applies pre-printed labels at 50–200 containers per minute with placement accuracy ±0.5 mm; Inkjet coding prints variable data (lot numbers, expiration dates, barcodes) at 300 dpi; Laser marking creates permanent marks for pharmaceutical and medical device packaging.
An integrated traceability system gives every unit a unique serial number linked backward to raw material lot codes, filling parameters, seal test results, and inspection data. If a retailer rejects a pallet, the manufacturer can trace the defect to the specific hour, machine, and operator — not to “sometime last month.”
Secondary Packaging and End-of-Line
Individual packages become shippable units here. The sequence typically runs: cartoning, case packing, palletizing, stretch wrapping.
Pace matching is the main integration challenge at this stage. A snack line producing 120 pouches per minute overwhelms a cartoner that handles 80 per minute — unless there is a buffer between them. A simple accumulation conveyor holding 3 minutes of upstream output gives the cartoner room to recover after a micro-stop without forcing the whole line to halt. Robotic palletizers finish the job: cobots handle 6–8 cases per minute; industrial robots push 15–20.
Integration Technologies — How Your Equipment Communicates
Physical connections get product from machine A to machine B. Communication protocols get information from machine A to machine B — and that is what turns a collection of capable machines into an intelligent production system. Protocol choice is not just an IT decision. It is a supply-chain decision: it determines which equipment brands you can buy, how fast your line responds to problems, and whether you’ll be locked into a single vendor’s ecosystem.
PLC-Based Control Architecture
The Programmable Logic Controller (PLC) is the brain of the integrated line. It runs on a continuous loop — scan all inputs, execute the logic program, update all outputs — with a typical cycle time under 10 milliseconds. In those 10 ms, the PLC checks whether the filler has completed its cycle, whether the seamer jaws are in position, whether the labeler sensor sees a container, and whether the upstream conveyor is running. Then it makes thousands of binary decisions and sends commands to every device on the line.
A small line of 5–8 machines needs a PLC with 200–500 I/O points. A large multi-zone line may need 2,000+ points. One rule that saves money later: reserve at least 20% of I/O capacity for future expansion.
Industrial Communication Protocols — A Practical Comparison
Different machines speak different languages. Here is what you need to make them interoperable:
Practical takeaway: Building a line with equipment from multiple vendors? Choose machines that natively support both EtherNet/IP and Modbus TCP/IP. That covers 90% of available equipment without needing protocol gateways. A gateway adds 5–15 ms of latency — usually harmless for monitoring, but risky for synchronized high-speed operations.
SCADA and MES — Beyond Machine-Level Control
SCADA gives you a single screen showing every machine’s status, speed, temperature, and alarm state in real time. MES connects the production floor to the ERP system: work orders flow down automatically, production counts flow up, and quality records are digitized and timestamped. For regulated industries, MES data retention is not optional — FDA 21 CFR Part 11 requires electronic records stored for at least 12 months.
Emerging Technologies — AI, Digital Twins, and IoT
You don’t need to invest in these today. But the decisions you make today should not block them tomorrow. Digital twins (virtual replicas accurate to ±2%) let you test changes without touching the physical line, cutting on-site debug time 30–50%. AI-powered vision catches defects it was never programmed to recognize, with recognition rates exceeding 99.5%. IoT and cloud let multi-plant operations compare and optimize across facilities. The common thread: OPC UA is the data highway that makes all three possible.
Planning Your Packaging Line Integration: A Phase-by-Phase Roadmap

Integration is a project, not a purchase. Here is the roadmap:
| Phase | Core Tasks | Key Deliverables | Timeline |
|---|---|---|---|
| Assessment | Product analysis, capacity calculation, equipment audit | User Requirement Specification (URS) | 4–8 weeks |
| Design | Equipment selection, layout, control architecture | Design drawings + FAT protocol | 8–16 weeks |
| Installation | Placement, single-machine commissioning, SAT | SAT report + operator manuals | 4–12 weeks |
| Optimization | Training, parameter tuning, KPI baseline | SOPs + KPI baseline report | 4–8 weeks |
Assessment is the most underinvested phase. A thorough URS should contain 50+ functional requirements — covering not just speed and accuracy, but also changeover time, cleaning procedure, product change frequency, ambient temperature range, and compressed air quality. Every hour spent here prevents roughly ten hours of rework during commissioning.
One real-world caution: a food manufacturer didn’t specify in their URS that their sauce product’s viscosity varied dramatically with temperature (thin and watery at 35°C, thick and paste-like at 10°C). The piston filler spec’d for “medium-viscosity sauce” jammed every winter morning. Fixing it required replacing seals, adjusting stroke parameters, and adding inline product heaters — a six-week delay and a five-figure unplanned cost.
Common Integration Pitfalls and How to Avoid Them
Most integration failures are not caused by bad machines. They come from bad assumptions made during planning — assumptions that seemed reasonable at the time but didn’t survive contact with real production conditions. Here are the four most common assumption failures, and how to catch them before they catch you.
Speed Mismatch — When Your Fastest Machine Creates the Biggest Bottleneck
The scenario: Your filler runs at 120 cans per minute. Your labeler runs at 100. That 20-can gap doesn’t sound like much — but over one hour, it’s 1,200 cans with nowhere to go. Your “120 cpm line” is really running at an effective 85 cpm once you factor in the micro-stops.
The fix: Buffer capacity should equal the maximum speed difference multiplied by 2–5 minutes of production. Program the PLC to use the labeler’s actual speed as the master reference, throttling the filler automatically. Design rule: Buffer length (units) = upstream speed (units/min) × 3 min × 1.3 safety factor.
Multi-Vendor Compatibility — The Protocol and Mechanical Interface Gap
The scenario: You bought the best filler from a German manufacturer, the best labeler from a Chinese manufacturer, and the best case packer from an American manufacturer. The filler’s discharge conveyor sits at 850 mm high, the labeler’s infeed is at 820 mm, and the case packer speaks Profinet while your PLC speaks EtherNet/IP.
The fix: Before signing any purchase order, require every vendor to submit an Interface Specification Sheet. A 30 mm height difference sounds trivial — but cans tip over at that transition, and 50% of unplanned stops trace back to that single misalignment.
Underestimating Changeover Complexity
The scenario: You evaluated machines by their maximum speed. But your facility runs 12 different SKUs and changes over three times per day. Machine A changes over in 10 minutes. Machine B takes 45 minutes. Your line’s changeover time is 45 minutes — the two hours of lost production every day add up to 500+ hours per year.
The fix: Require vendors to commit to changeover time in writing. For any machine exceeding 15 minutes, mandate quick-change features: tool-free knobs, locating pins, and digital recipe storage.
The Hidden Cost of Skipping Factory Acceptance Testing
The scenario: The vendor tested each machine at their factory. It all worked. Why pay extra to do it again? So you skip the integrated Factory Acceptance Test (FAT) and ship directly to your facility.
The fix: The FAT must include: minimum 8 hours of continuous operation, all product SKUs, and deliberate testing of edge cases. FAT acceptance criterion: OEE ≥85%. A problem found at the vendor’s site is fixed at the vendor’s expense. The same problem found at your site is fixed at your expense — plus lost production. Skipping the FAT to save $15,000–30,000 has cost manufacturers hundreds of thousands in startup delays.
Evaluating ROI — When Does Integration Make Financial Sense?
Integration is a capital investment. A mid-sized food manufacturer upgrading from semi-automatic standalone machines to a fully integrated packaging line should expect to invest $200,000–$800,000 depending on line complexity, speed, and customization requirements. The real question is not “can we afford it?” but “how fast does it pay for itself?”
The ROI of packaging line integration comes from three buckets:
Direct labor savings. An integrated line reduces operator requirements from 5–6 per shift to 1–2 — a 40–60% reduction. For a two-shift operation in a developed market, that translates to roughly $160,000–$240,000 in annual savings.
Productivity gains. Eliminating manual transfers removes the single biggest bottleneck. Integrated lines typically achieve 20–40% higher throughput — not because the machines are faster, but because they’re never waiting for a person.
Hidden cost avoidance. These savings don’t appear on a purchase order: 50–70% less product waste from manual handling; zero customer penalties from mislabeled product; 90% faster recall response; and the ability to accept orders requiring the quality consistency only automation delivers.
Most packaging line integration projects achieve payback within 2–4 years. Lines running two or three shifts recover their investment significantly faster — each additional shift amortizes the fixed equipment cost over more production hours. When you run the numbers for your own facility, look beyond the equipment cost. Include installation, facility modifications, training, and the productivity dip during transition. Then compare against the full cost of staying put.
For operations ready to turn the ROI analysis into an actionable plan, working with an experienced line integrator who can model the full cost picture — including your specific product characteristics, labor market, and growth targets — turns a spreadsheet exercise into a buildable project. Companies like Levapack, which provide custom turnkey canning lines from infeed to palletizing, offer one-to-one engineering consultations to design a line matched to your product, capacity, and budget — so you are not paying for capabilities you don’t need, and the ROI timeline is grounded in your real numbers rather than industry averages. Explore custom turnkey canning line solutions or request a tailored line proposal.
How to Choose the Right Integration Partner
You have read this far because you’re serious about packaging line integration. You understand the components, the technology, the planning process, the pitfalls, and the financial case. The last question is the hardest: who do you trust to execute?
Selecting an integration partner is not about comparing spec sheets. The real differentiators are harder to measure — and they’re what determines whether your line runs at 85% OEE or 55% OEE two years after commissioning.
1. “Show me two lines you’ve built for products similar to mine — and give me the plant manager’s phone number.” A credible integrator provides verifiable references without hesitation. Integration expertise is product-specific. A company excellent at integrating liquid filling lines may have never dealt with powder dust containment.
2. “What OEE do you guarantee — and what happens if it doesn’t meet that number?” An integrator who won’t commit to a specific OEE number is not standing behind their system design. An achievable integrated-line OEE guarantee is typically 80–85%.
3. “Do you use your own equipment, or do you integrate third-party machines?” Single-source accountability vs. best-of-breed flexibility — know which model you’re signing up for and make sure it matches your internal engineering capability.
4. “Will the FAT be at your facility, using my real products, running continuously for at least 8 hours?” A proper FAT with real product catches problems that a water test never will: viscosity effects on fill accuracy, dust accumulation on sensors, residue buildup on sealing jaws.
5. “Who is my single point of contact, and how often do I get progress updates?” A competent integrator assigns a dedicated project manager with a written schedule of milestones and decision gates.
6. “What’s your warranty period and guaranteed response time?” Industry standard is 12 months. Anything longer — 16, 24 months — is real additional value covering the period when most latent issues surface.
Trust your red-flag detector. A proposal priced 30%+ below the competition is cutting something — usually FAT scope, installation support, or warranty coverage. The “cheaper” option that skips integration testing and hands you a pile of manuals instead of on-site commissioning support is not cheaper. It is deferred spending with interest.
References
- Tayal, A., et al. “Effectiveness Improvement in Manufacturing Industry: Trilogy Study and Open Innovation Dynamics.” 2021. sciencedirect.com


 EN
EN  RU
RU  ES
ES  FR
FR  DE
DE  NL
NL  IT
IT  JA
JA  ID
ID  PT
PT  KO
KO  AR
AR  TH
TH  VI
VI  TR
TR  PL
PL